Version 1.0
The widely accepted method for calculating the volume of subcutaneous tumors is to measure the length and width of the tumor with a caliper, and, while assuming that the tumor is the shape of an ellipsoid and that the height of the tumor is equal to its width, use the formula for the volume of an ellipsoid.
Most, if not all, tumors do not fit into this category; this discrepancy results in caliper-based volume measurements including sections that do not exist in the actual tumor, or an overestimation of tumor volume measurement. Furthermore, caliper-based measurements cause undue stress on the animal and, by extension, the tumor, which can further distort measurements. Measurements of tumors, in the context of research and industry, are expected to be accurate; it is unacceptable that this inaccurate formula has stood so long as the industry standard.
Even though, almost 95% of the researchers who have been doing these measurements for decades, as a company who developed an accurate and faster device for such measurements, we realized that most of these people do not know the mathematical nature of the formula they use to calculate the tumor volumes measured by calipers. The aim of this article is therefore to explain of the tumor volume formula and the problems associated with the caliper measurements.
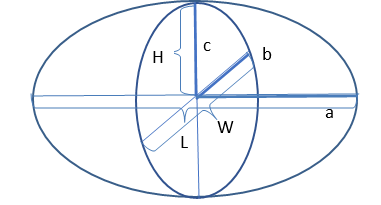
Figure 1. A diagram of an ellipsoid, with the derivations of the variables needed to calculate its volume. The tumor dimensions are L, W, and H.
The volume of an ellipsoid VE, using the variables as shown in Figure 1., is,
where r is the radius of the sphere.
Almost 90% of the establishments that make tumor volume measurements using calipers use a modified version of the ellipsoid formula, under the incorrect assumption that a tumor is always a perfect ellipsoid. The variables for the volume of a tumor, as measured by a caliper, are determined by a, b, and c in Figure 1, where length L is 2a, width W is 2b, and height H is c. VT, the volume of a tumor is determined by,

For the sake of convenience, establishments will simplify π and H. They, for historical reasons (when this formula was stated being used, all the calculations were done in one’s head), incorrectly assume that π is equal to 3.0 and that the height of a tumor (H) is equal to its width (W). Under these conditions, the formula for the volume of a tumor becomes,
This is the formula most used in research and industry. Even though, now, the formula is calculated in an Excel spreadsheet where π can be defined as a function, pi(), almost in all cases, in the volume formula π is defined as 3.0.
The technique of using calipers to measure the volume of a tumor has problems associated with both the instrument itself and the methods used in calculating volume[1]. Firstly, since the tumor is assumed to be an ellipsoid shape, and the tumor’s morphology often deviates significantly from this as it grows, this method will produce errors as big as 18.4%.[2]no matter how accurately the length and width of the tumor are measured. Additionally, this technique is plagued by the inconsistent selection of tumor axes at subsequent examinations. For small tumors, the error is about 7%, while for large tumors it is 27%.[3]

Figure 2. A tumor expands in width rather than height as it grows.
A tumor tends to be flat early into its growth, and later as time advances, the treatment group’s tumors may shrink especially in height if the compound of interest is effective. In both cases, the height of the tumor will be much smaller than its length or width (Figure 2.). If the length or width of a tumor is twice its height, which is often the case for many tumor models, then its measured volume will be overestimated by 50%.
The width of a fully formed tumor will be much larger than its height. Tumor cells form and expand subcutaneously in the cavity they are injected, into between the layers of the skin. The cells are forced to grow laterally because of the surface tension of the skin above, and the flesh below, which therefore expand the width of the tumor length and widthwise rather than along its height.
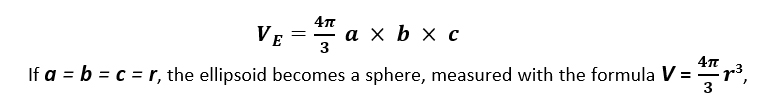
Figure 3. A graph depicting tumor volume in mm3, as measured by a caliper compared to its actual volume, vs. days.
The overestimation of caliper measurements is due mainly to the fact that the formula used is that of a parallelepiped, a shape unlike an ellipsoid actually represents the geometric body that is being measured. Therefore, its formula will always overestimate the tumor volume until the height equals its width, as seen in Figure 3. The closer the shape of the tumor is to a perfect ellipsoid, as in the region of the graph in which H closely ≈ W, the more closely caliper measurements mirror real-life measurements. As the height values of the tumors deviate from those of the width, the caliper-based volume values of those tumors begin to mirror real-life measurements less closely. Thus, caliper-based measurements, using the formula  , are most accurate in real life for tumors in which height roughly equals width but prove less accurate as height becomes more unequal to width, as is the case with almost all real tumors.
This concept can easily be understood by a simple “thought” experiment: the volume of a stack of pennies (Figure 4.). An average penny has a diameter of 19 mm and a height of 1.27 mm, yielding a volume of 360.1 mm3. If one measures the volume of a penny using calipers and uses the widely accepted formula, repeating the measurement each time another penny is added to the stack, the stack will yield the same volume each time, regardless of how many pennies are stacked. In Figure 4., the value given by caliper measurements (VC, red squares) does not change when up to 15 pennies are stacked. On the other hand, values given by a scanner (VS, red triangles) more closely follow the true volume of the pennies (VT, blue diamonds). The caliper, unlike the scanner, does not consider that the height of the stack changes while the length and width remain the same. Thus, caliper-based measurements are less accurate the more the height of the stack deviates from its width.
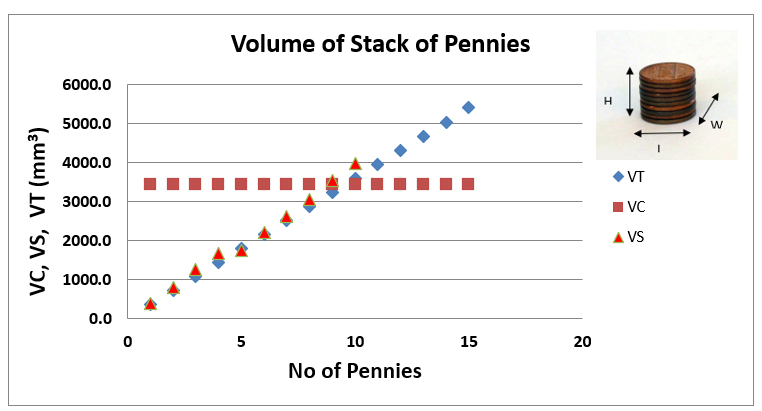
Figure 4. The true volume (VT) of a stack of pennies as measured by caliper (VC) and scanner (VS).
A study[4] (Figure 5.) depicts the inaccuracy of the formula used for caliper measurements, in which the height of the tumor is assumed to be equal to its width. In one trial, 208 tumors were measured, and 98.94% of those tumors exhibited much smaller heights than widths. In another, 7,286 tumors were measured and 99.97% of those exhibited smaller heights than widths. The lines on the graphs have a slope of 1, signifying that it represents caliper-based measurements in which height equals width. Each dot, in addition to signifying a real-life tumor’s width and height, also signifies through the right y-axis what percentage of a caliper-based measurement with the same width it is.
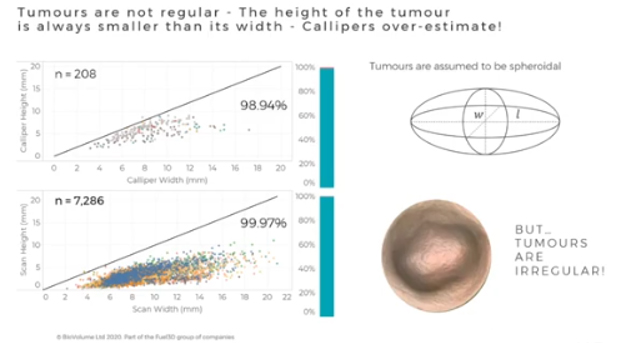
Figure 5. A study[4]on caliper measurements, shoved the very poor accuracy of the formula used for caliper measurements.
Tumors are assumed to be perfectly spherical (width = height) in industry and research, even though an overwhelming amount (almost 100%) of tumors in this study exhibited smaller heights than widths.
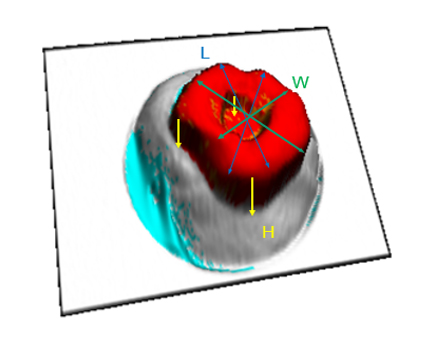
Figure 6. The shape of the tumor, more often than not, is not an ellipsoid.
Figure 6. depicts three components used to measure the volume of a tumor: its length, represented by blue arrows, its width by green, and its height by yellow. The tumor shown has a “dip” in its form, which means that its volume will be less than that of a tumor without a “dip.” A caliper measurement would only take into account the components for length and width and therefore ignore this “dip” measured by the values for height, which would, in turn, inaccurately measure the tumor’s volume.
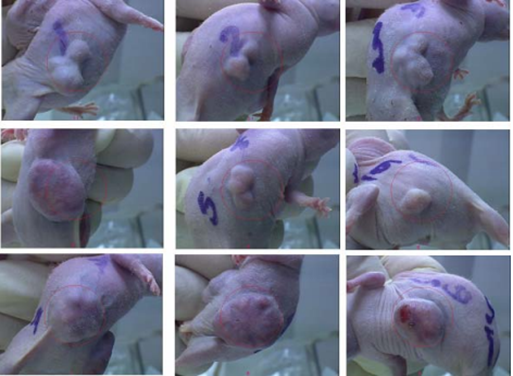
Figure 7. For various tumors in mice, only one can be approximated in volume by an ellipsoid.
Later in a study, when a tumor grows into larger masses, the shape of the tumor can differ greatly from an ellipsoid, as shown in Figure 7. Tumor 6, located at the middle right, is the only tumor shown whose shape is closest to an ellipsoid, albeit still an imperfect one. The other eight tumors exhibit forms that cannot be compared to a perfect ellipsoid.
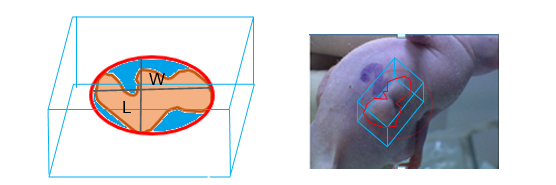
Figure 8. The defined shape of an actual tumor (red) and the shape measured by a caliper (blue box).
Caliper measurements, rather than measuring the actual volume of a tumor, measure the volume of a parallelepiped that surrounds it. This results in the inclusion of sections of the parallelepiped’s volume that does not exist in the actual tumor. At this critical stage in the tumor’s growth, the caliper-based volume measurement will generally be larger than the tumor’s actual volume, since the longest axis of the parallelepiped will be partially empty. The volume above the red area is not occupied by the tumor, as seen in Figure 8. Because the industry’s caliper-based formula allows for these inclusions in nonexistent volumes more often than not, it yields inaccurate measurements, which can confuse.
Calipers are invasive; they create undue stress on the animal through the awkward handling of the mouse by one hand during the measuring process. Generally, to make caliper measurements, the measurer first traps the tail of the mouse under her fingers, then, grabs the neck of the mouse, and aligns the mouse in her hand in a way to expose the tumor for length and width measurements. This process slightly stretches the body and deforms the tumor. Also, at beginning of the tumor growth when the tumor is invisible or when a tumor shrinks due to the effectiveness of the drug, in order to measure the volume of such an “invisible” tumor, it is a general practice to palpate the tumor area to reveal some mass to measure. This process not only deforms the tumor mass but also creates undesirable pain on the animal.
In caliper measurements, two values, for length and width, must be recorded for one tumor in each animal; this means that for every 100 animals studied, at least 200 measurements must be made and recorded. Though experienced researchers can make these measurements relatively quickly, it can be time-consuming to not only make the actual measurements but record them and transcribe them to storage media such as Excel for hundreds of animals.
The scan images obtained are only for the external surface of the tumor. The volume calculation algorithm relies on the surface interpolated based on the surrounding healthy tissue. If this surface intersects above the bottom of the tumor, then the volume estimation of the tumor will be smaller than the true value as can be seen from Figure 9. Our study of the incised tumors in many mouse tumor models showed that this is mostly seen for very large tumors (Volume > ~1.5 cm3) where the tumors start bulging inward toward the flesh. Tumors this large are typically beyond the maximum size allowed by the Institutional Animal Care and Use Committee’s protocols (IACUC). We found out that due to this unmeasured part, the dissected tumor volumes were about 6% larger than the scan results. Even though we did not have a statistical analysis of volume loss due to the unmeasured part of tumors in caliper measurements, the lost volume could be higher than the scanner results. Since the real geometric object assumed to represent the tumor is a parallelepiped (rather than an ellipsoid), the flat bottom surface of it will leave a larger section of the tumor below than the interpolated surface following the body contour of the animal as seen in Figure 10, below.
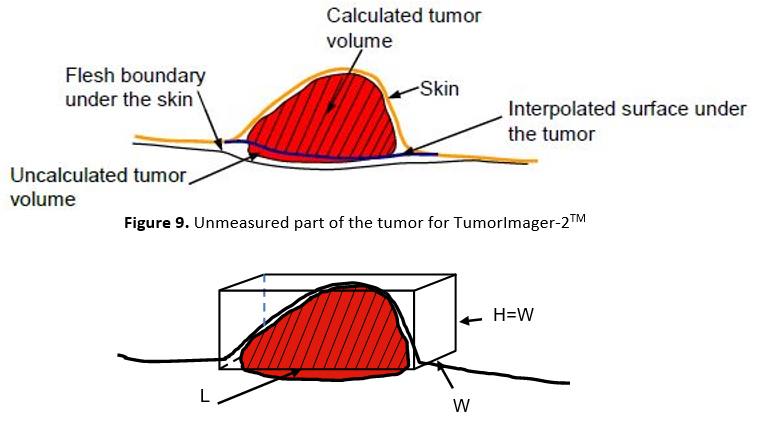
Figure 10. Unmeasured part of the tumor for caliper
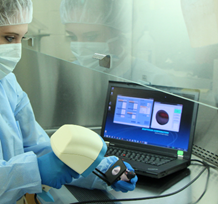
Figure 11. Tumor measurement by TumorImager-2TM
Studies using other methods of imaging have exposed the problems that calipers pose. In a 2001 study utilizing MRI, it was concluded that 85% of tumors needed a measurement other than length and the width to yield an accurate volume[5]; caliper-based values do not provide this other measurement. In addition, studies using CT scans concluded that CT yielded tumor volume values 11 to 12% less (an underestimate) than those which were measured by calipers, and that CT-based measurements yielded more accurate and consistent values than caliper-based measurements[6, 7].
A solution to these problems is the TumorImagerTM scanner. A patented algorithm running in the TumorManagerTM program calculates the tumor volume by creating a 3D surface map of the tumor (red-colored surface in Figure 12.). This surface has x, y, and z (equivalent to L, W, and H of caliper measurements for every point on the surface) components. It then segments the tumor boundary (red area surrounded by the yellow boundary in Figure 12.) and calculates an interpolated surface under the tumor boundary based on the healthy surface around the tumor (navy blue line in Figure 12.). Finally, it finds the volume between these two surfaces and sets this to be the volume of the tumor (shaded red region in Figure 11, red region in Figure 14 below).
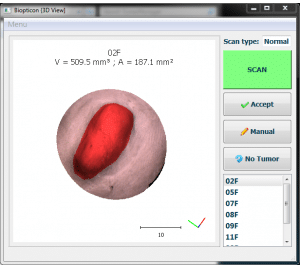
Figure 12. Tumor segmentation by TumorImager-2TM
During the scan, a mouse should be held in a relaxed manner without stretching its skin to cause unwanted deformation of the tumor body. This can happen if the mouse is pressed into the mask or if the body is stretched when held. Stretching of the skin around the tumor of the mouse will cause an under-estimate of the tumor volume since the tumor is pressed into the body (see Figure 13. below). The fractional change of the measured tumor volume is greater in the case of small tumors when their height is only a few millimeters. Without prior training of users, this effect can lead to greater variability in intra and inter-user measurements.
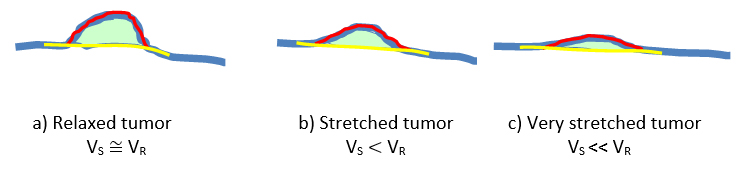
Figure 13. Effects of holding an animal on tumor volume while scanning.
As it was discussed above, the handling of animals by calipers measurements also suffers such deformations of the animal body during the measurements. Since, the assumptions made to measure a 3D object with 2D measurements, the error due to the geometrical assumption are larger than the errors due to handling of the animal causing deformation of the tumor, and this aspect, in general, is ignored.
Importantly, these measured size differences are real; they are not due to a miscalculation by the algorithm but due to the pressing of the tumor mass into the body. A smaller diameter mask will help to position the tumor in the center of the scan, but it will not alter this effect.
Better results can be obtained by proper handling of the mice. Care should be taken not to stretch the mouse whether using one or two hands to hold the mouse during a scan. As is the case with caliper measurements, if the tumor appears visibly flattened and is hard to see by eye then the mouse should be repositioned. Tumors should also be placed so that the tumor peak is near the center of the mask and is not highly inclined.
In order to reduce such deformations on the tumor during measurement, it is possible to reduce the stress on the body of the animal by using two hands. Another approach is to utilize the scan images (Figure 14.) produced by the TumorImager-2TM so that the animal is aligned under the mask each time similarly to the previous scan. These images also provide extra morphological information about the tumor growth and the effect of the compounds on tumor behavior.
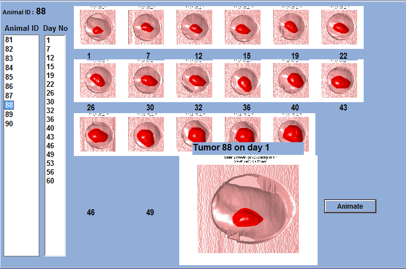
Figure 14. Tracking tumor growth with real tumor scan pictures.
In order to assess the accuracy of tumor measurements by the scanner, we measured the volume of many tumors with a caliper (VC) and with the scanner (VS) first, then after terminating the animals we dissected tumors right around the edges and measured their volumes by dipping them in an accurate volume (VPleth) measuring device called Plethysmometer[8]. This device measures the volume displacement of the water due to any object dipped into a measuring cylinder. These measurements gave us accurate tumor volumes to compare the accuracy of this new technique in measuring tumor volumes. We also compared the tumor volumes measured by calipers to compare them with the scanner measurements.
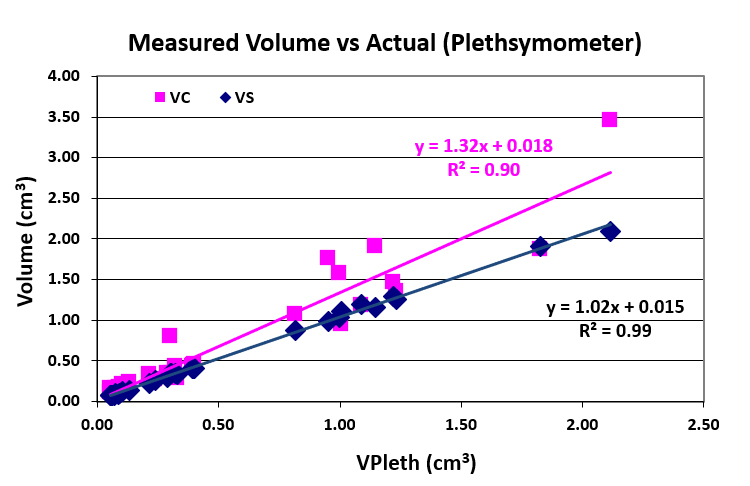
Figure 15. Tumor volumes measured with a Plethysmometer (VPleth) independent of caliper and scanner measurements (VC, VS) vs. VC and VS
| No | L | W | H | VC | VCH | VS | % Inc. |
| 1 | 11.76 | 6.34 | 2.33 | 236.35 | 86.86 | 88.4 | 167 |
| 2 | 6.43 | 5.36 | 1.98 | 92.37 | 34.12 | 26.9 | 243 |
| 3 | 5.08 | 5.82 | 2.01 | 86.04 | 29.71 | 29.5 | 192 |
| 4 | 19.41 | 11.35 | 5.58 | 1250.22 | 614.65 | 672.4 | 86 |
| 5 | 11.16 | 9.86 | 4.73 | 542.49 | 260.24 | 214.7 | 153 |
Table 1. A typical comparison of tumor volume measurements by TumorImager-2TM with calipers. VC refers to tumor volume values calculated through the formula VT = 0.5 × L × W2, and VCH refers to those through the formula VT = 0.5 × L × W × H. VS refers to measurements taken by the scanner, and % Inc. refers to the percent increase between VS and VCH.
In Figure 15., the linear regression equation for the best-fit line for VPleth values on the y-axis along with VC and VS values would be approximately y ≈ x, or y ≈ 1.00x + 0.00. The closer the slope of a line on this graph is to 1 and the y-intercept to 0, the closer the measurements of the device it represents are to the exact values of the tumors’ volumes. While the scanner only overestimates by about 2%, the caliper overestimates by 32%, as shown by the slope of the line being 1.32.
In addition, the root mean square, R2 values under the linear regression equations in Figure 15. symbolize the precision of the data. The closer the value is to 1, the more precise the data. The R2 value for the scanner is 0.99, as opposed to that for the caliper being 0.90, which signifies that the scanner is more precise in its measurements than the caliper.
In order to understand inter-operator differences between operators making both caliper and scanner measurements, we conducted experiments in which multiple numbers of operators measured several tumors both with caliper and scanner. Then we calculated the Coefficient of Variance between such measurements for both measurements to compare average inter-operator differences.
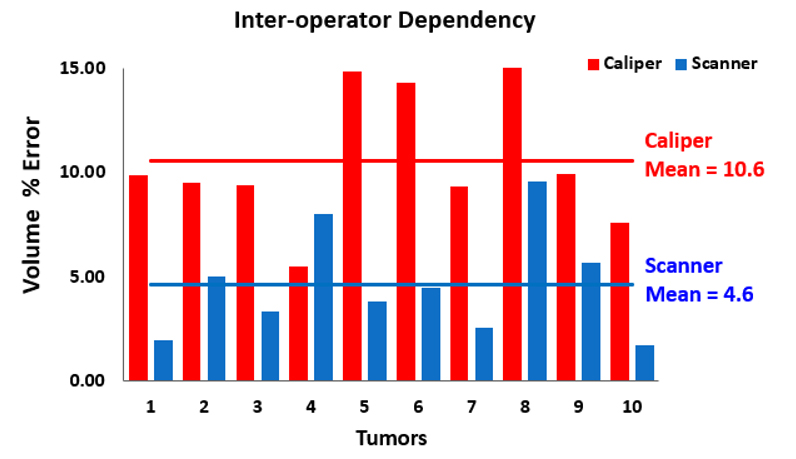
Figure 16. Comparison of volume measurement results between four users.
Figure 16. depicts the results from a study attended by Biopticon in which ten subcutaneous tumors in mice were measured by scanner and caliper by four operators. The tumor number, from one to ten, is shown against the percent error. The caliper mean-percent-error is 10.6%, nearly twice that of the scanner’s mean-percent-error of 4.6%.
Below, we present the results of some sample studies in which independent companies doing pharmaceutical, biotech, and cancer research organizations made trial runs to assess the new 3D technology and compare them with their standard caliper measurements. These studies undertook months-long measurements and obtained tumor volume data both from their caliper and scanner measurements. Most of the operators in these studies were highly experienced in caliper measurements, but they only had one day of training in scanner measurements. The results presented here were provided by them.
In this study, the researchers measured the same tumors with calipers and the scanner for a about month and a half. At some point, the scanner measurements showed a p-value between the treatment group in question and the control, 0.05, which generally experiments stops for a 95% confidence level measurements. Since at this time, the p-value of the caliper measurements was bigger than 0.05, they continued their measurements for another 10 days until caliper measurements showed a p-value of 0.0484 as shown in Figure 17.
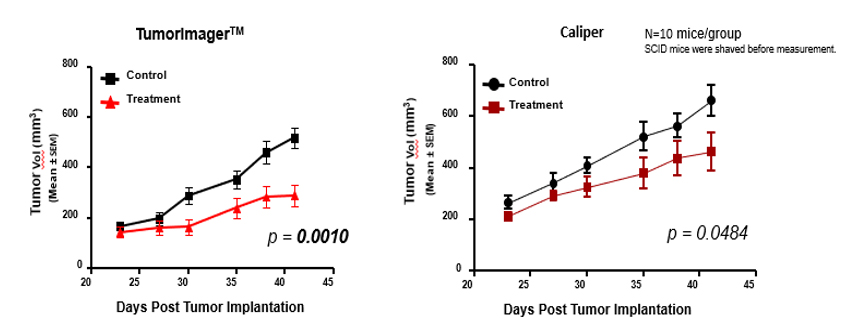
Figure 17. Caliper- and scanner-based measurements during the various stages of a tumor’s growth
Notice that in the caliper group, the average standard deviation is larger than that of the group whose tumors were measured by Biopticon’s TumorImager™ scanner. A smaller standard deviation in a set of measurements suggests a lesser possibility of error. A standard deviation of 0% is almost impossible in real life, but a smaller standard deviation is generally favorable.
In addition, the gap between tumor volume values for caliper-based control and treatment groups is smaller than that for scanner measurements; the significant p-value was over 50 times higher when using calipers (p > 0.05) than with scanners (p < 0.001), suggesting that the caliper-based measurements are not statistically significant. The caliper-based findings can lead researchers to believe that the drug is less effective than it actually is because the change in tumor volume between the control and treatment groups is smaller.
Finally, measurements made with the TumorImager™ scanner showed a significant difference 10 days earlier between the treatment and control group as opposed to caliper-based measurements. This saves money, as mice, drugs, and calipers can be costly for researchers.
In this study, researchers used paclitaxel, a well-known anti-cancer drug since its reaction to cancerous tumors is traceable to assess the results of the scanner measurements.
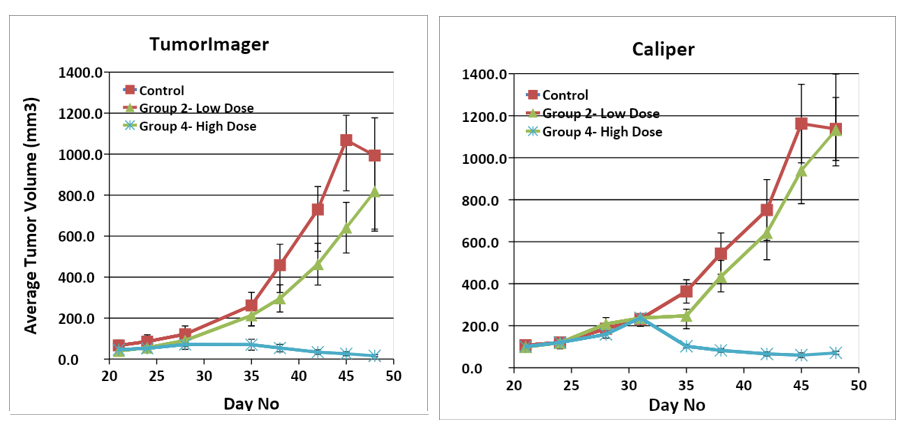
Figure 18. Results from an experiment that measures tumor volume and varies drug dose and measuring methods.
Figure 18. shows the results of an experiment in which mice were given different doses of a drug and their tumors were measured both with a caliper or TumorImager™ scanner. Notice that the caliper-based measurements have a larger standard deviation. In addition, even though there is about a 20% difference between the low-dose treatment group for the scanner measurements, the caliper-based measurements do not show any effect for this dose. Similar to the results from the experiments in Figure 18., this error makes the drug seem less effective than it actually is.
In a study done in England, the researchers at the end of their experiment, dissected tumors and measured their weight with a precise balance, and used these weight values of the tumors to compare results of the caliper and the scanner measurements.
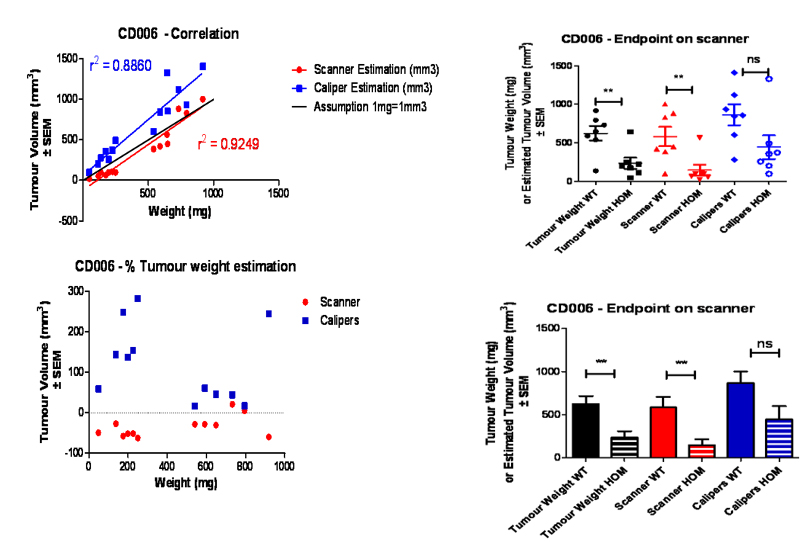
Figure 19. Results from a vaccine trial from AstraZeneca
In the top-left graph (Figure 19.), the more correlated a given group (scanner or caliper estimations) is to the black line (r2 = 1), the more accurate the tumor volume measurements are. The scanner-based measurements yield a higher correlation in this sense than caliper-based measurements. On the bottom left graph in Fig. 20, the red dots that represent scanner-based measurements are closer to the black dotted (objective) line than the blue squares that represent caliper-based measurements. Notice that the red dots are generally underestimations, while the blue squares are generally overestimations; the former is because of the unmeasured part of the tumor, as discussed in Section 3.5, and the fact that tumors tend to grow under the surface of the skin rather than above it in their early stages of development, and the latter is because of the inherent overestimation in the industry-standard caliper-based formula.
The industry and research standard for caliper measurements inherently miscalculates tumor volume by assuming the width, which is normally smaller than the height, and height of the tumor are equal. In addition, calipers also place undue strain on the animal during measurement, assume conditions for a perfect ellipsoid (which most tumors are not), and can lead to unnecessary losses of money over time. The TumorImagerTM line of scanners by Biopticon Corporation fixes these problems by keeping the animals relaxed during measuring and yielding measurements closer to actual values than caliper-based measurements. Because tumor volume measurements used by researchers and industries are sensitive and often rely on the accuracy, the cutting-edge TumorImagerTM line of scanners is the ideal, most reliable choice for taking such sensitive measurements.