TumorManagerTM is a fully integrated program that allows scientists to manage every aspect of their subcutaneous xenograft tumor studies. Using an intuitive user friendly interface the program allows complete control of every step including:
Caliper volume calculations are based on three assumptions. The shape of the tumor is assumed to be an ellipsoid. In most cases, the height of the tumor is assumed to be equal to its width. And the number pi is set to be 3, resulting in a tumor volume formula, V = 0.5 x L x W x W. The first two assumptions are not fulfilled throughout tumor growth. At the beginning of tumor growth, tumor heights are much smaller than the tumor widths. And the shape of the tumors deviate away from ellipsoid at the later stage of their growth. These two assumptions, therefore, result in larger than real tumor volume estimates.
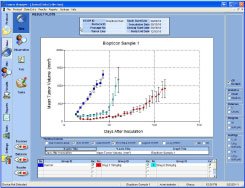
In addition to size, our system provides tumor volume calculation. Results of a study including this data are more accurate and more detailed.
A few of the problems with tumor size calculation and tumor volume calculation using calipers are summarized below:
Extensive involvement of human operators can cause transcription errors, either when recording the data in the laboratory during the measurement phase, or when transferring data to a spreadsheet. Protocols often change from one study to another, e.g. the number of animals, or the number of groups. Modifying spreadsheet templates to adapt to these new parameters can also cause additional errors.
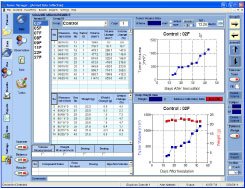
Paper or Excel-based results are generally static; therefore, real-time information such as Tumor Doubling Time (TDT), Log Cell Kill (LCK), T/C etc is not available to the scientist. Using TumorManagerTM these important parameters are calculated and plotted after every measurement is made. Parameters such as TDT can be very useful to a researcher to monitor the progress of a study when they are available instantaneously.
Spreadsheet like programs typically have very limited statistical analysis capabilities. They do not provide ANOVA based multiple comparison analyses (e.g. Dunnett, Duncan, etc.), or Kaplan Maier survival analysis. Data from these spreadsheets need to be transferred to a commercial statistical analysis program for further analysis adding to the complexity and time requi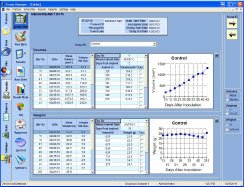 red. The turnaround time can be even longer if the data must sent to a biostatistician for further analysis.
TumorManagerTM is a program designed to eliminate all of the above-mentioned problems. TumorManagerTM stores all data in a standard MS SQL Server database. Data inquiry and storage are validated. When each tumor size measurement is taken all information related to that data including the identity of experimenter, date and time of the measurement and the device used is recorded. TumorManagerTM protocols are defined by the study manager ensuring full user compliance even the nomenclature to be used.